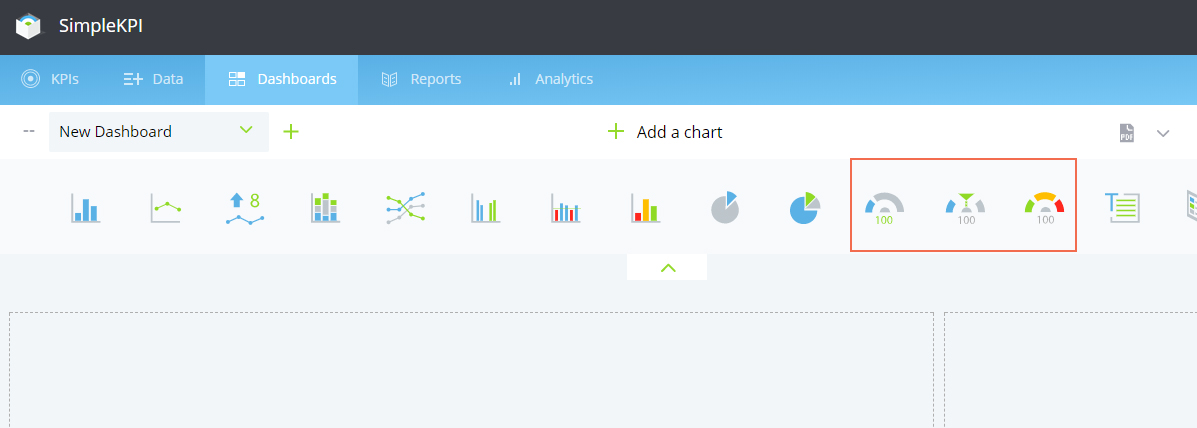
Gauge Views
The SimpleKPI Dashboard offers 3 main types of Gauges, these Gauges can help you visualize individual KPIs against Target, Goals and Thresholds(RAG).
Contents
The Target Gauge
The Target Gauge is the simplest of the three dashboard Gauges; you can select a KPI and see the value very much like the single KPI view. If the KPI has a target assigned to it this will also show up on the Target Gauge.
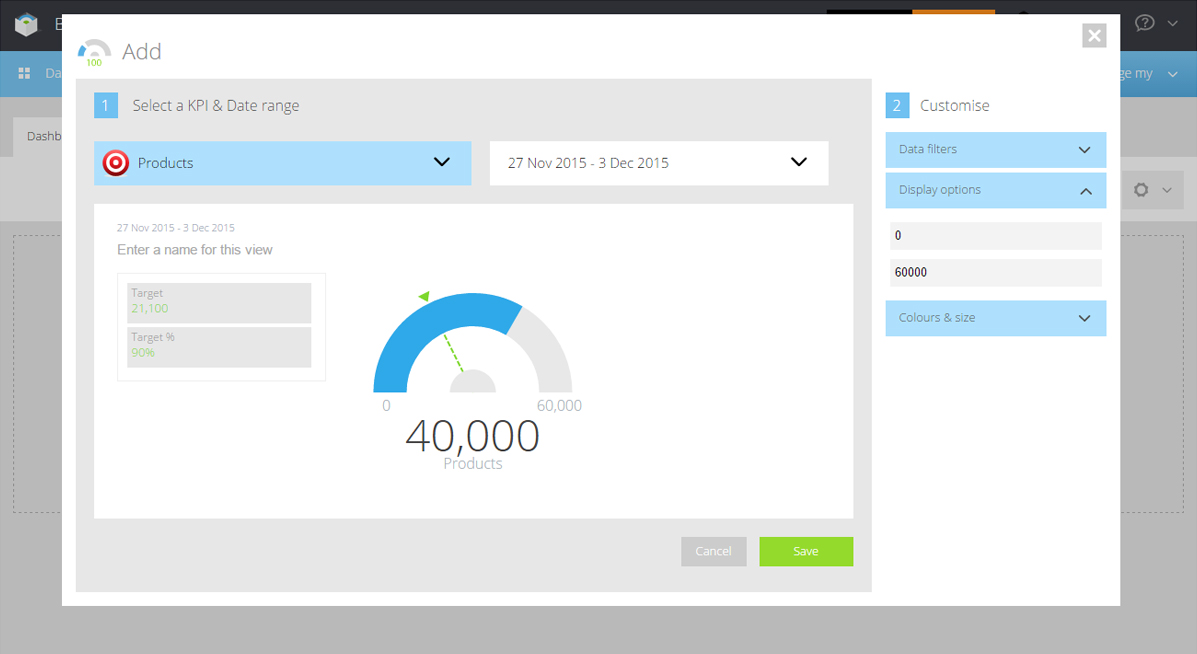
Adding a Target Gauge
- Click the Target Gauge icon
- Select the KPI you wish to use on the Gauge
- Select a time period for the Gauge
- Modify the minimum and maximum values of the Gauge
- Once you are happy with the preview, save your Gauge to the dashboard
Note: You can also customize colors, sizes, filters and values for each of the Gauges from the options panel 3.
The Goal Gauge
The Goal Gauge is similar to the Target Gauge except that you can define a Goal in the future based on a date and track the performance of a KPI towards that goal.
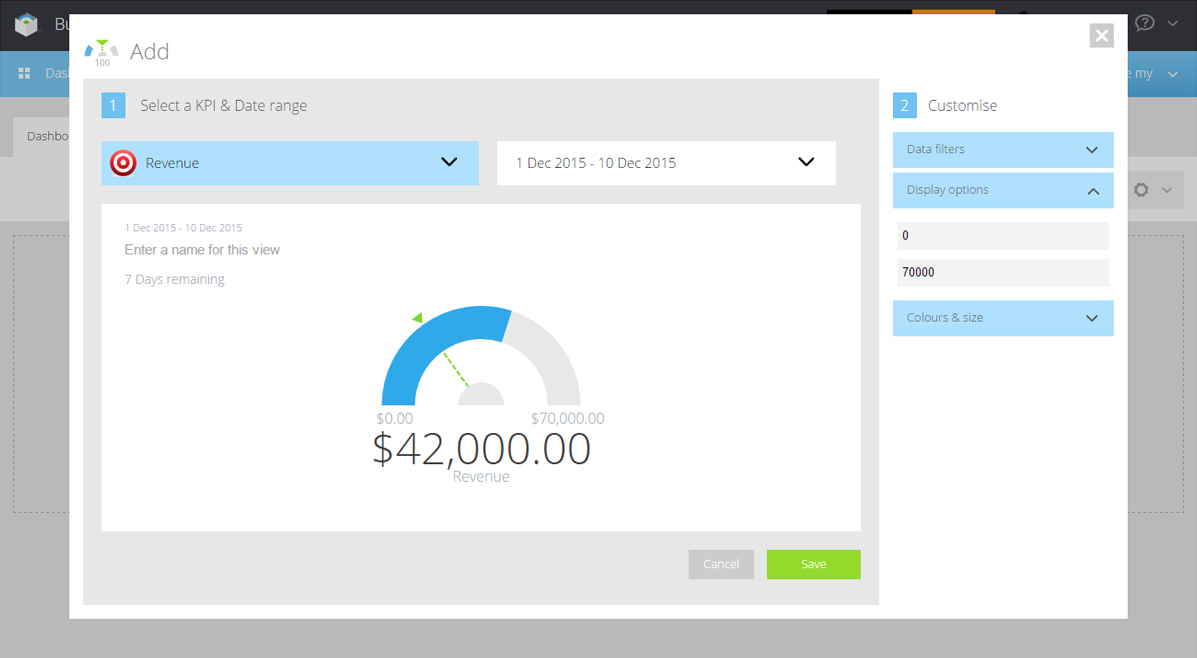
Adding a Goal Gauge
- Click the Goal Gauge icon
- Select the KPI you wish to use on the Gauge
- Select the to and from date option from within the date selector
- Choose the start date and the end date(this will be the goal date).
- You can modify the goal end and start value by entering a new value in the start and end fields
- Once you are happy with the preview, save your Gauge to the dashboard
The Goal Gauge displays various information relevant to the goal, such as:
- The amount of days left towards the Goal
- The actual value of the KPI to date - The thick Gauge Line
- The % over or above the value the KPI should be at today's point in the Goal
- The green line indicates where the value should be in relation to achieving the goal value to date
The RAG Gauge
The RAG Gauge is one of the best charts for visualizing any RAG thresholds set up for your KPIs. It provides a clear indication of your KPI value against your thresholds in a clear concise manner.
RAG thresholds can be added when setting up a KPI or overwritten in the options panel 3.
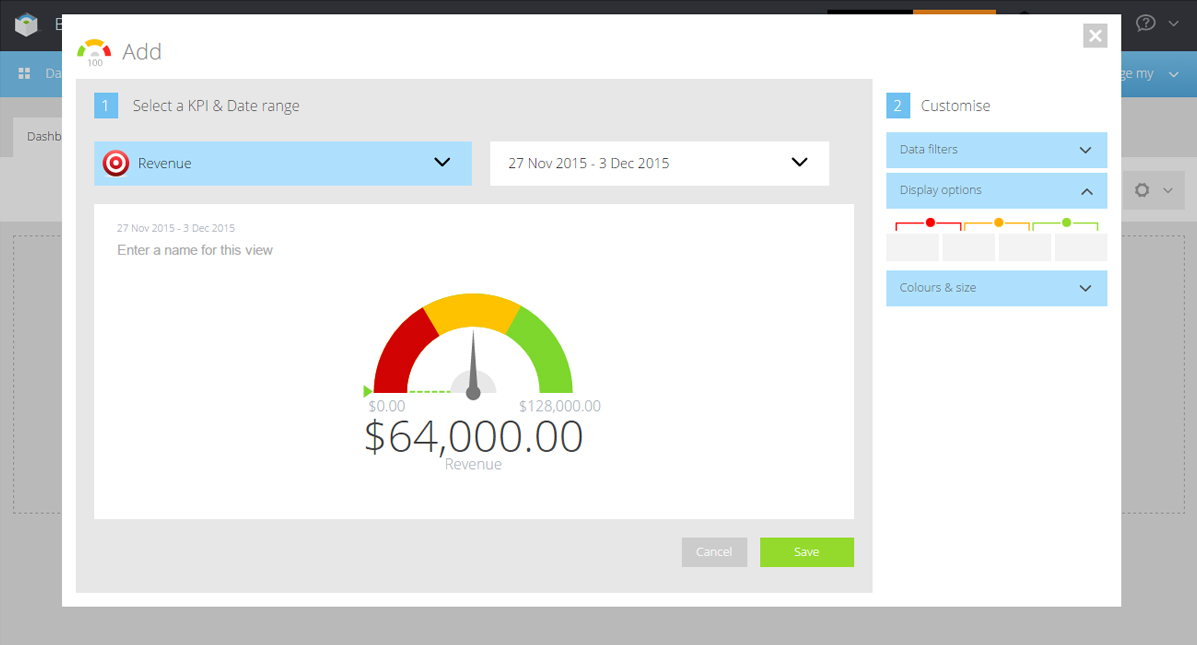
Adding a RAG Gauge
- Click the RAG Gauge icon
- Select the KPI you wish to use on the Gauge
- Select the date range you wish to measure
- You can set or overwrite the RAG thresholds for the Gauge by entering values between the Red, Amber and Green points – More on RAG thresholds can be found here
- Once you are happy with the preview, save your Gauge to the dashboard
The values of your KPI between the selected date periods will be multiplied along with the RAG Thresholds. You can average your values between these dates along with the threshold values by changing this setting under the KPI Advanced settings > KPI Tab.