Setting up your SimpleKPI account
Welcome to SimpleKPI! This guide will lead you through the steps needed to get your account up and running as quickly as possible.
If you do not already have an account, you can create one here.
There are a few key steps to creating your account:
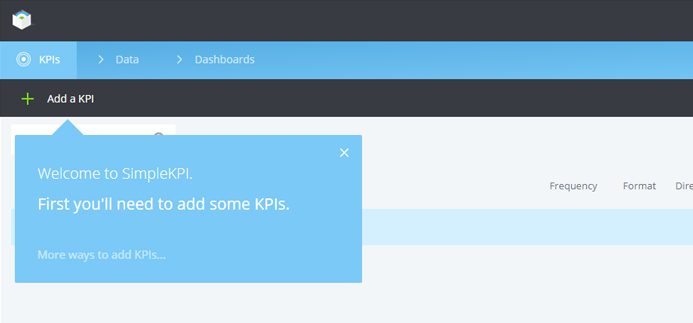
Your starting point will be 'The getting started view' this will help guide you through your account set-up. You can also use this screen to contact support, learn more about SimpleKPI and KPI tracking.
Adding your KPIs
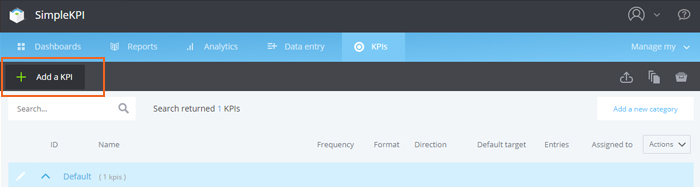
- To begin adding your KPIs click the Add Your KPIs button from the getting started menu.
-
From the KPIs screen you can add your KPIs in two ways:
- Add KPIs Manually
- Import your existing KPIs from a spread sheet
If you are unsure of the KPIs you need for your specific industry or business then please check out the KPI Knowledge center.
Adding KPIs Manually
To add KPIs Manually here's what you need to do (the green info icons located next to each item on the interface also offer more information):
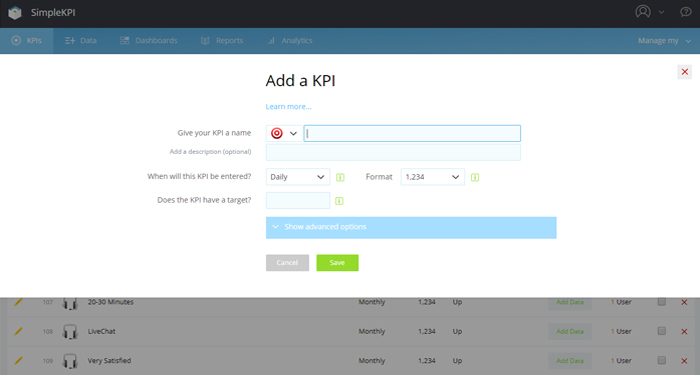
- Enter a Name for your KPI and a Description
- Select a Display Icon (this will be used on reports and dashboards to identify your KPI)
- Select when this KPI should be recorded
- Choose a format for your KPI such as %, $, Minutes
- Select a direction
- Add a target for this KPI (more information on setting KPI targets can be found in the Setting Targets section)
- Select a category for your KPIs (Optional: To organize your KPIs, you can create categories from the left hand menu.)
- When you're done, Click Save
The KPI you just created will now appear in the KPI list, to add another KPI click the Add a KPI Button.
To add more KPIs, simply repeat the process. You can also create Calculated KPIs and access more options by clicking the Show Advanced Options link located in the left hand column (Note: you must add at least one KPI first before this option will be visible) More information on calculated KPIs can be found here.
You can edit any of your KPI’s by clicking the orange edit Icon.
Back to topImport your KPIs
To add KPIs from an existing spread sheet you will need to reorganize your data and columns into the SimpleKPI Standard. More information on spread sheet imports can be found here.
- To upload your KPIs click the upload your KPIs link on the top right of your screen.
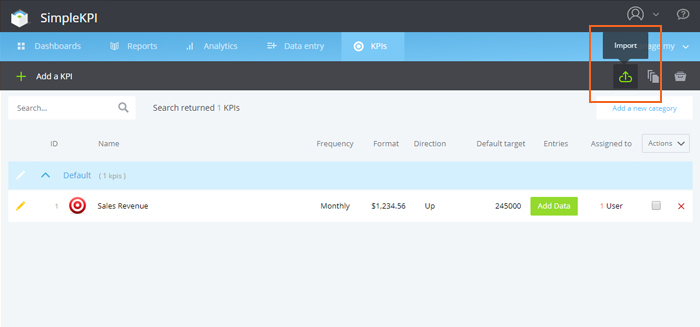
- Click the select an Excel File
- Browse to the file
- Click upload and import
Add Data to your account
You can add data to your account in various ways. Here we will focus on the most common types, more information on data import can be found here.
- Add your data manually
- Upload a spread sheet
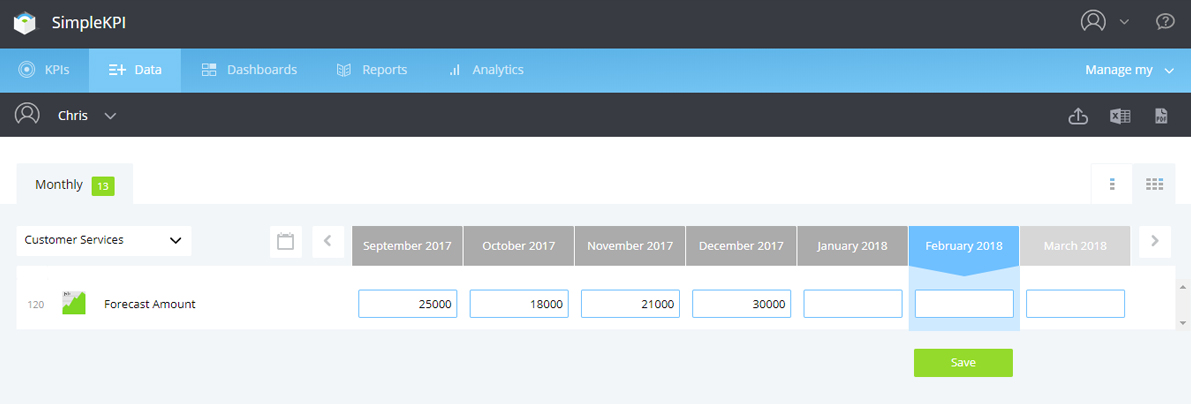
- Click the Data Entry tab from the header navigation bar.
- Select the date you would like to enter the data against by selecting either the forward and back arrows or the calendar icon.
- To add the data just click on the entry field under the actual column and enter your data. (there is no need to save as this is done automatically)
- You can also add notes to your entries by clicking on the notes icon.
Add a Dashboard
Once you have added data to your account you can create dashboards, reports and analytics views to help you visualize your data.
To add your first dashboard click on the dashboards tab
The first time you see the screen the 'add a dashboard' settings panel will be open, to set-up your first dashboard:
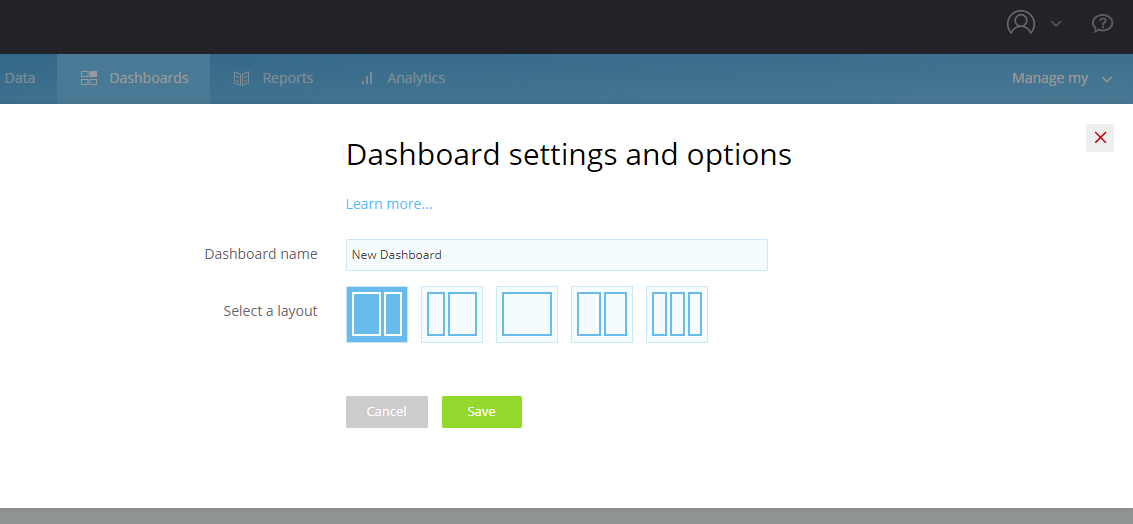
- Add a Name for your dashboard
- Select the layout (Optional: you can change the layout later)
- Choose either a dark or light background for your dashboard
- Click the Add button
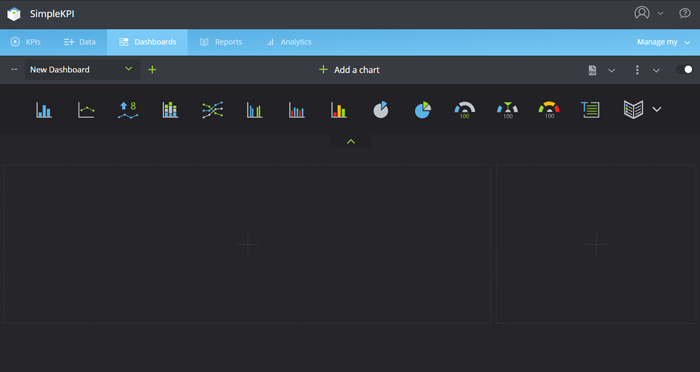
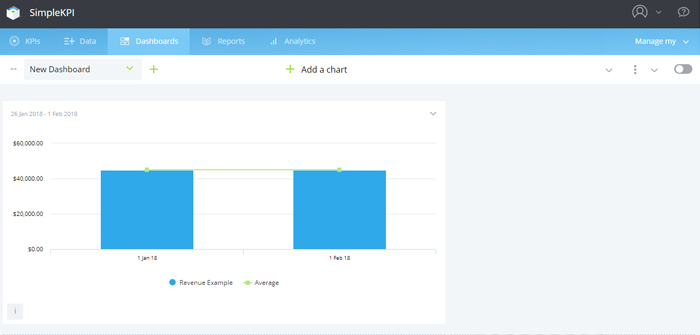
Once you have a dashboard set-up you can start adding graphs, charts and views.
- To add a new view click one of the chart or graph types
Once you have selected a chart type you will be shown the chart builder screen, here you can select KPIs, Dates and generally customize the chart for your requirements.
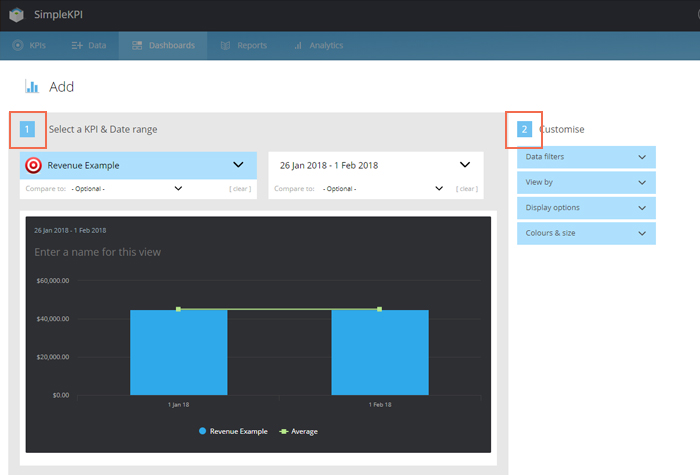
To create a new chart view:
- Click the KPI drop-down to select the KPI you want to display in the chart
- Click the date drop-down to specify a date or date range
- Customize the view Name
- Select your options from the right hand menu, such as whether to show targets, changing the size of the graph and even the graph type.
- Once your happy with the chart preview, click the Add to my Dashboard button
The more data you enter the better your Dashboard Charts will look.
- To add another chart or view, click the Add a New View button
- To add a new dashboard, click the + icon tab located next to your latest dashboard
More extensive information regarding the Dashboard and chart types can be found here.
Adding Users
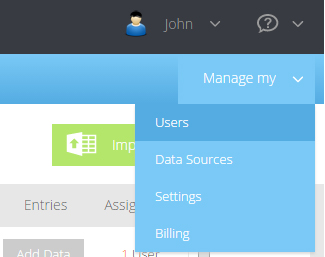
You can add users to your account by clicking the Manage My / users selection in the drop-down list.
There are a couple of ways to add users to your account, you can invite them through the system to register or you can add them manually.
You can arrange your users into any number of groups such as teams, offices or locations. This enables the system to report and analyze on different segments of users. To learn more about groups click here.
- Click the Add a New User button
- Enter the users details, name, email and password
- Select which groups the user belongs to
- Set the privileges for your user, more information about users and privileges can be found here
- Click the Save Button
- To edit a user click the orange edit icon next to the users name