Creating & Customizing Reports
The reports screen provides the ability to view all the performance of your KPIs in one convenient location. You can also use the report functions to compare against different dates and filter results using groups and users.
Contents
- Creating Reports
- Selecting your KPIs
- Using the Date Control
- Report Options
- Comparing KPIs
- Saving Reports
- Exporting Reports
- Sharing Reports
Creating Reports
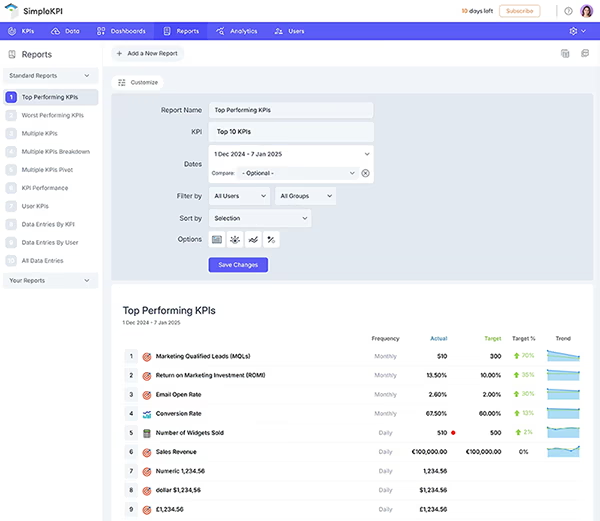
When you first navigate to the reports tab, the default "Top Performing KPI" report is selected. The left-hand menu provides access to a range of standard reports as well as your saved reports. Standard reports can serve as a starting point, allowing you to customize the data to suit your requirements and save it as a new report for future use.
Selecting your KPIs
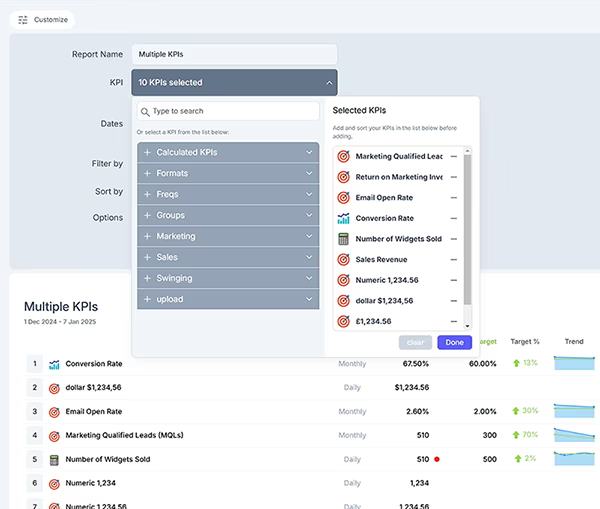
- To change or select other KPIs to include in your report, click the Select a KPI drop-down menu.
-
The sub-menu is divided into two areas:
- The left-hand KPIs list divided into categories.
- Selected KPIs that will appear in your report.
- You can search for a KPI using the search function or manually navigate through the categories.
- Once you find the desired KPI, click the add link next to the KPI name.
- The KPI will appear in the selected list on the right-hand side.
- To remove any selected KPIs, click the x icon next to the KPI name.
- Click done to finalize the KPIs for your report.
Using the Date Control
- To select a date period, click the drop-down date control.
- Select a standard date period.
More infomration on using the date control can be found on the data control page
The report will automatically update to display data based on your date selection. You can also set your own date range from the date drop-down menu.
- Click the date drop-down control.
- Click the date range option.
- Select a start date using the left-hand calendar controls and click a day to select the date.
- Select an end date using the right-hand calendar control.
- Click done.
The chart will now display data based on your selected date range.
Report Options
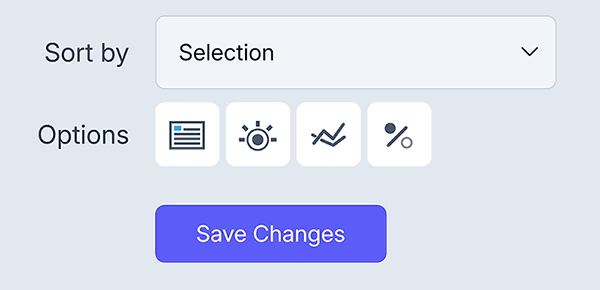
Reports come with several options to help provide more meaningful insights. You can access report options from the top of the report view window and use them to:
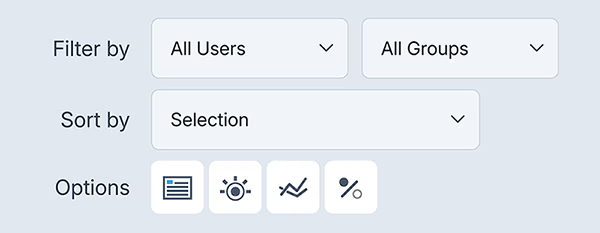
- Hide/Show the frequency.
- Hide/Show the trend.
- Hide/Show the % of Target.
-
Sort by:
- Actual
- % of Target
- % Change
- A-Z
- Z-A
By default, the report view shows the combined value of the selected KPIs. You can filter this view by groups or individual users:
- Click the user or group drop-down and select the user or group you wish to filter by.
- Click done.
The view will now display KPI values for only the selected users or groups.
- To clear this filter, deselect the values in the filter drop-down and click done.
Comparing KPIs
You can compare KPIs in your report using the "Compare To" feature in the date control. To compare KPIs against another time period:
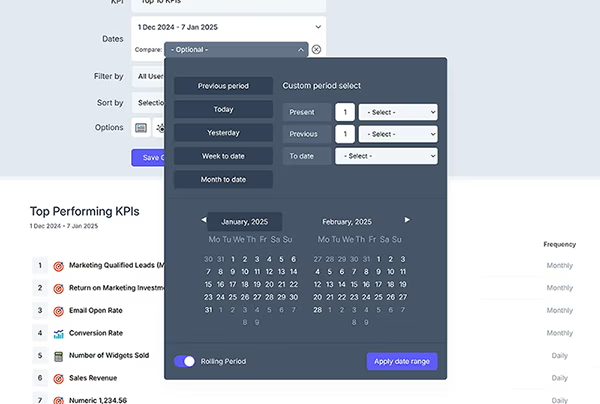
- Click the Compare to drop-down under the primary date.
- Select a default time period or enter a custom time period from the date control.
- Click done.
The report will now display data for the two selected dates along with an overall % change.
- To remove the compare date, click the [Clear] link in the date control.
Saving Reports
- Click the Save Icon in the right-hand report options.
- Enter a new name for your report.
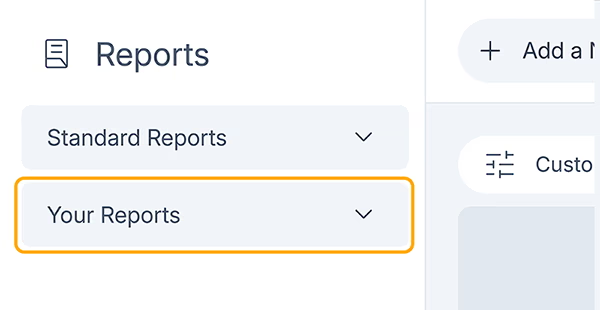
- Your new report view will appear in the left-hand menu.
- To edit or delete a report, use the edit and delete icons in the right-hand menu.
Exporting Reports
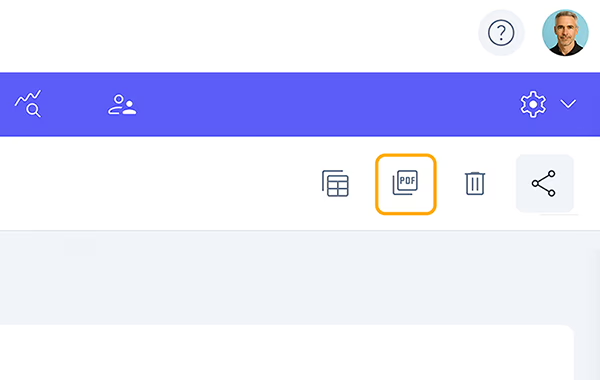
- Click the PDF Icon or Excel Icon to export your report.
Sharing Reports
You can share any of your saved reports with different groups or users.
Note: Only saved reports can be shared. Default reports cannot be shared, and the share icon appears only for shared reports.
- Click the Share Icon.
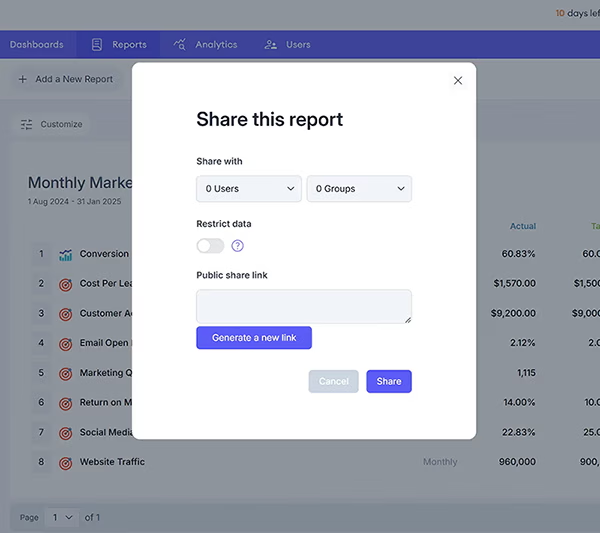
- Select users, groups, or a combination of both from the sharing dialog.
- Use the "Restrict Data" option to control what users see in the shared report. Selecting "Yes" will display only the data users have access to, while "No" allows them to view all data.
- Click share to finalize.