Back Dashboards
- Creating Dashboards
- Dashboard Settings
- Sharing Dashboards
- Embedding charts externally
- Dashboard charts
- Dashboard Gauges
- Full Screen Mode
Externally Embedding Charts
SimpleKPI offers an array of dashboard graphs, charts and controls to help visualize KPI performance. These charts can be embedded outside of the application on websites, intranets and web portals by using the embed feature.
Contents
Embedding a graph
In a few simple steps you can embed any of your dashboard charts:
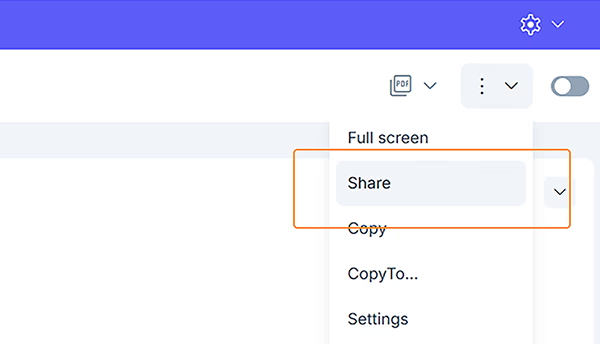
- Click the edit dropdown icon at the top of the chart you wish to embed.
- Choose the share option from the menu.
- Click the 'Generate embed code'
- Cut and paste the unique embed code and paste in your website code.
Canceling an embedded chart
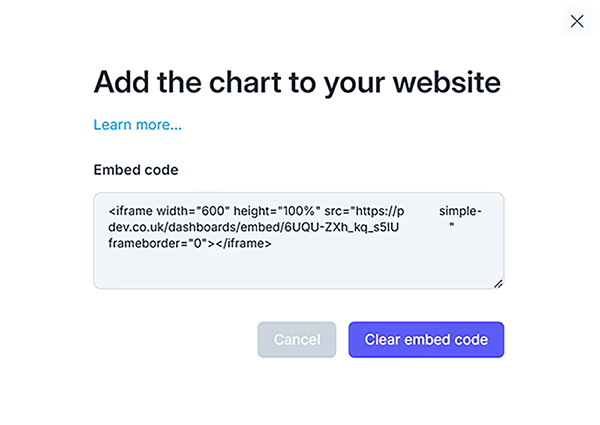
To cancel an embedded chart, click the embed icon and click the 'Clear embed code'.