Back KPI's and Targets
- Creating KPIs
- Adding Data Manually
- The KPI Screen Explained
- Targets
- Assigning KPIs & Targets to users
- Calculated KPIs
- Threshold indicators (RAG)
- Weighted Averages
Threshold Targets and RAG Indicators
Setting a range of indicators on a KPI can allow you to monitor performance within defined thresholds. Each threshold is defined by one of three colors RED, AMBER and GREEN, these are also referred to as traffic light indicators or RAG.
Contents
- Setting up a range of indicators
- Setting up a single range
- Open ended ranges
- Displaying RAG in Reporting and dashboard views
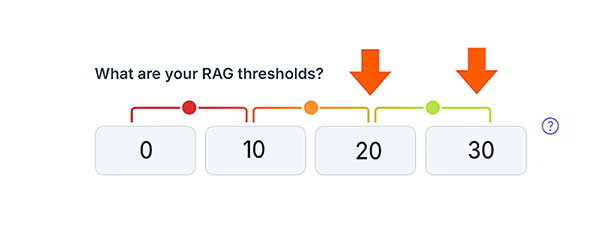
Setting up a range of indicators
- Click the 'Show advanced options' in the KPI edit screen.
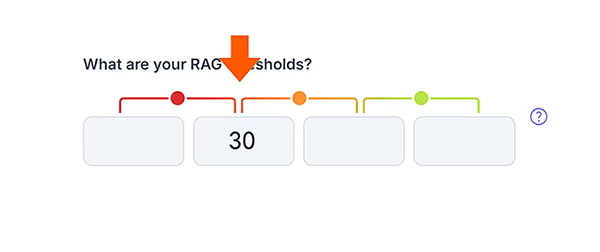
- Select a starting value and an end value in the first two fields to create a range for the RED indicator. All data that is entered for this KPI that falls between the start and end values will be displayed as RED.
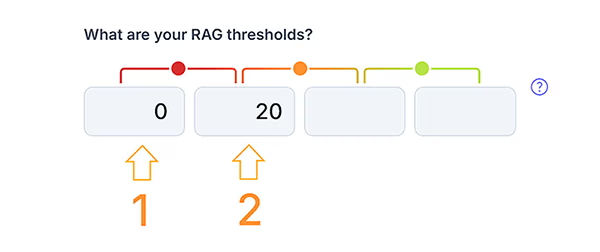
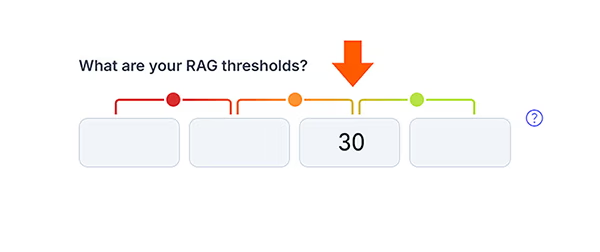
- Add an end value for the AMBER and GREEN indicators.
- Click the SAVE button.
Setting up a Single Range
You can set just one of the indicators if a whole range is not suitable. Any of the colors can be used for setting a single range.
- To set a single range enter the start and end values for your chosen color.
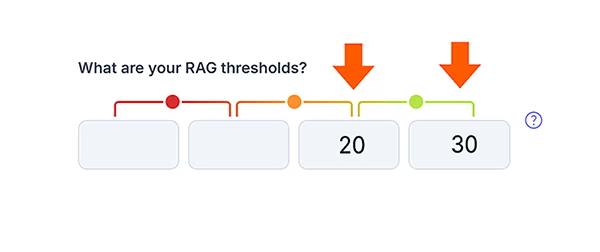
Open ended ranges.
To set an open ended range (where any data entered over or under a value appears as RED or GREEN).
- To set a lower open ended value click the second box and enter your value. – All data entered that is below this value will appear as RED.
- To set an upper open ended value, click the third box and enter your value. – All data entered that is below this value will appear as GREEN.
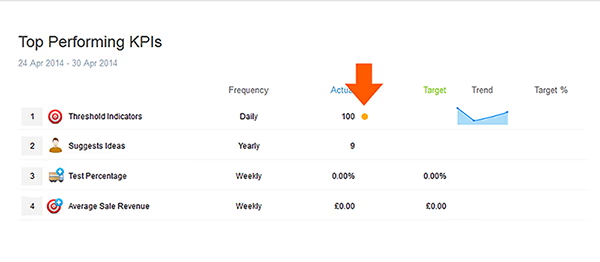
Displaying RAG in Reporting and dashboard views.
KPIs that have thresholds applied will automatically appear in reports and dashboards.
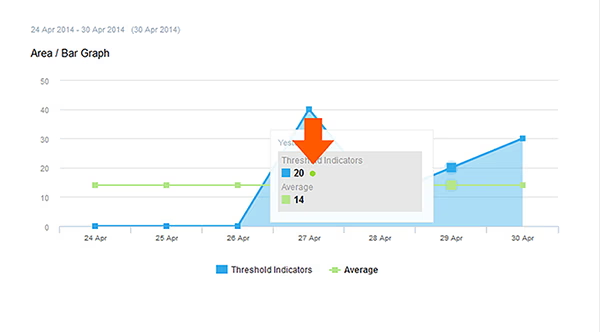
The color indicators appear as either RED, AMBER or GREEN circles next to the values of the KPI.