- Creating KPIs
- Adding Data Manually
- The KPI Screen Explained
- Targets
- Assigning KPIs & Targets to users
- Calculated KPIs
- Threshold indicators (RAG)
- Weighted Averages
Creating KPIs
SimpleKPI offers multiple ways to create and add KPIs to your account, catering to different needs and workflows. Whether you prefer manually entering your KPIs or integrating data from existing apps, we’ve got you covered. In this guide, we’ll walk you through each option step-by-step to help you get started quickly and efficiently.
Creating KPIs: The options
There are four ways to create KPIs in SimpleKPI: manually, with the KPI Generator, by uploading a spreadsheet, or through app integrations.
- Manually Adding KPIs: Perfect for quick, straightforward KPI creation.
- Using the KPI Generator Generate KPIs effortlessly with just a few clicks.
- Uploading a Spreadsheet Import KPIs in bulk using your existing data.
- Integrating with another app Seamlessly sync KPIs from tools you already use.
Adding your KPIs Manually
Manually entering your KPIs provides a flexible and straightforward way to customize them to fit your exact needs. This method is ideal for creating KPIs tailored to specific goals or workflows
- From the KPIs tab, click the Add a KPI Button

The popup to create your KPIs manually has 3 elements:
- The basic information required to create a KPI.
- Advanced options for configuring settings like targets.
- Calculated KPIs using formulas.
To add a basic KPI:
- Enter a name for your KPI.
- Select an icon using the Icon Selector. Icons will appear on reports and dashboards.
- Add an optional description to provide additional context.
- Select a frequency to determine how often you’ll record data. For example, choose "Monthly" if you plan to input data once a month instead of daily.
- Select a format to define the data type, such as currency, percentage, or time.
To fine tune your KPI
- Click the More Options Dropdown
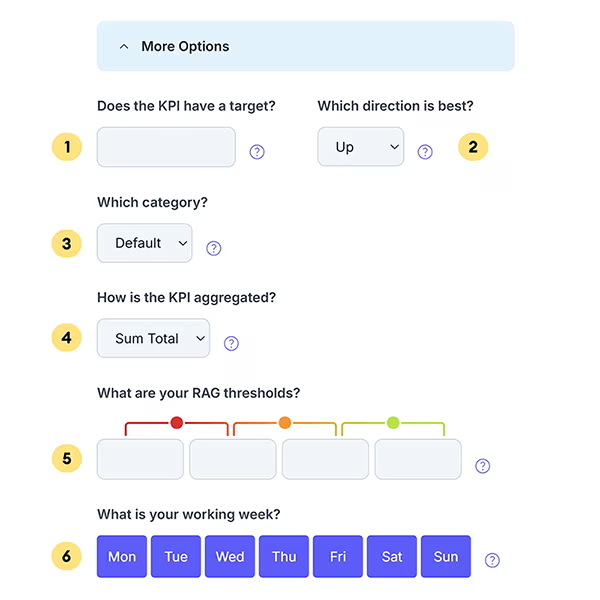
The "More Options" panel provides additional tools to create a KPI tailored specifically to your needs. These include:
- Add a target for the KPI. Learn more about setting KPI targets here.
- Choose the ideal direction for the KPI based on its purpose—for example, revenue might increase, while customer complaints decrease.
- Specify a category to organize and store the KPI.
- Define how the KPI should be aggregated, either by sum or average.
- Set up RAG (Red, Amber, Green) thresholds to visually indicate if values fall within specified ranges. Learn more about RAG indicators here.
- When entering daily KPI data, specify the available days of the week for data entry, such as Monday through Friday.
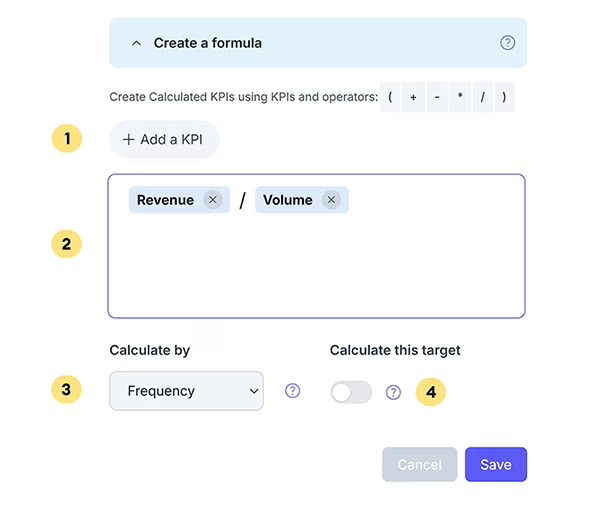
To create a Calculated KPI or KPI Formula
- Click the Create a Formula Dropdown
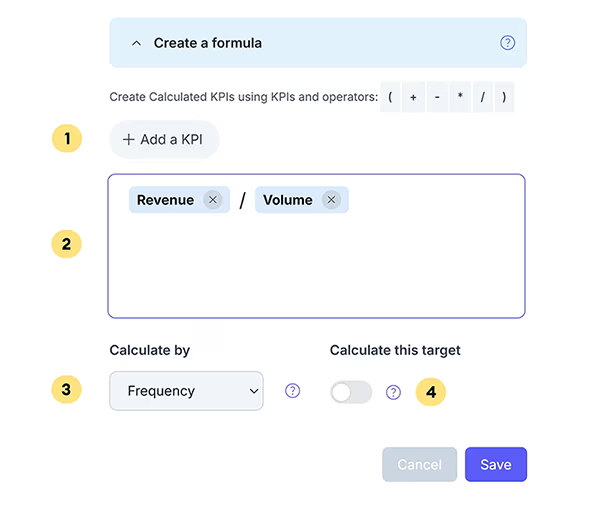
The calculated KPIs panel provides the features to creaate calculated KPI formulas, more on calculated KPIs can be found here. To create a Calculated KPI:
- Click the Add a KPI button to view a list of the KPIs you’ve created that can be used in your formula. Select a KPI from the dropdown to add it to the formula window.
-
Use operators such as
+ - / *to build your formula. -
Select how you want the formula to calculate:
- By Frequency: Run calculations based on the frequency set up for the KPI.
- Total: Run calculations based on the total of the KPIs in the formula over the time period selected in charts and reports.
- If the KPIs in your formula have targets, you can choose to automate the targets based on those.
Using the KPI Generator
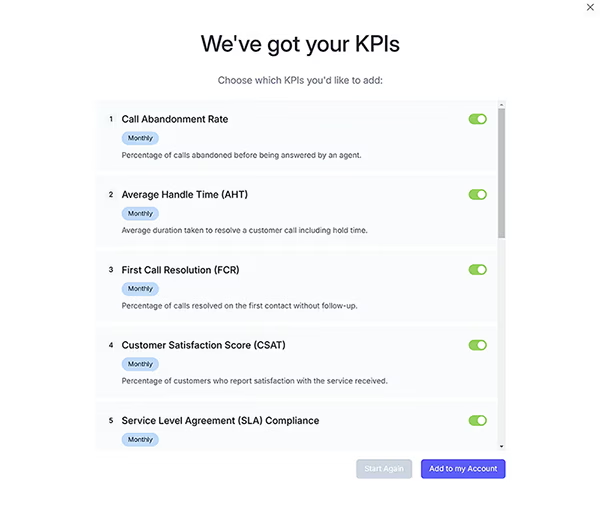
The KPI Generator leverages AI to create a selection of KPIs that you can easily add to your account.
- Click on the KPI Generator from the KPI action bar.

You can enter prompts for your KPIs, such as "Top KPIs for Call Centers" or "Marketing KPIs for the Tourism Industry."
- Enter your prompt in the prompt field and click Generate.

- Once the AI Generator returns your KPIs, use the toggle button on the right to select which KPIs to add to your account.
- When you’ve selected your KPIs, click Add to My Account.
Import KPIs from a spreadsheet
You can import your KPIs using the SimpleKPI standard spreadsheet template.
- Click the dropdown labeled 'upload a spreadsheet'
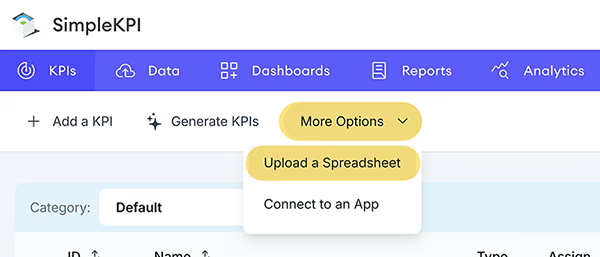
By clicking the 'Download an Example' will download a sample spreadsheet file you can use for uploading your own KPIs. More information on uploading KPIs can be found here
- Click the dropdown labeled 'upload a spreadsheet'
- Upload your spreadsheet by dragging the file to the designated upload box, or clicking on the browse button.
If a file fails to load, a file containing the errors will be provided, allowing you to make the necessary changes and upload it again.
Integrating Your KPIs from Another Application
Sometimes your KPIs may be stored in other apps, such as CRM systems, accounting tools, or marketing platforms. With SimpleKPI, you can seamlessly integrate with hundreds of these apps through our proprietary integrations and Zapier.
- Click "More Options," then select the Connect to an App option.
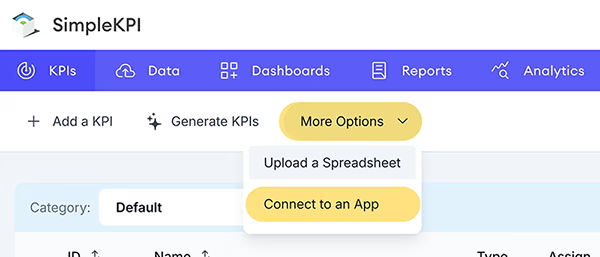
- Click the Add a Data Source button.
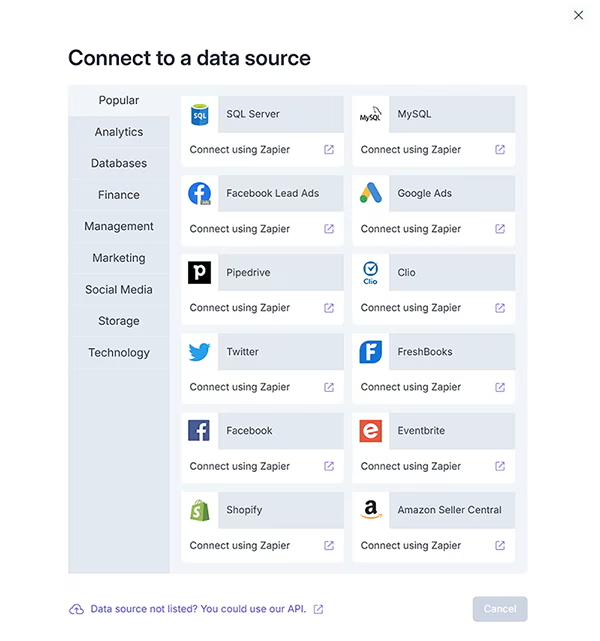
The available connections are categorized in the left-hand menu. Click the menu options to toggle between the categories.
- Click on one of the data sources to start the integration process.
More on integrating KPIs from other apps can be found on the Data Integrations page