Creating Data Users
Data users are a unique type of user within SimpleKPI designed to help you track Key Performance Indicators (KPIs) for specific items—such as people, products, properties, machines or any entity—without granting them login access to your system. This flexibility is perfect when you need to monitor performance metrics for various items but do not want those items to consume a standard user license or access sensitive data within your account.
Data users streamline your KPI management. Instead of creating separate KPIs like "Property 1 Sales" and "Property 2 Sales" for each item, you simply assign a single "Sales" KPI to multiple data users. SimpleKPI automatically keeps each data user's data separate, allowing you to filter, compare, and analyze their specific contributions to overall KPIs—while maintaining a clean and efficient KPI structure.
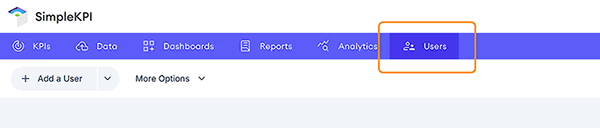
Navigate to the Users Tab
- Go to the Users section from the main navigation.
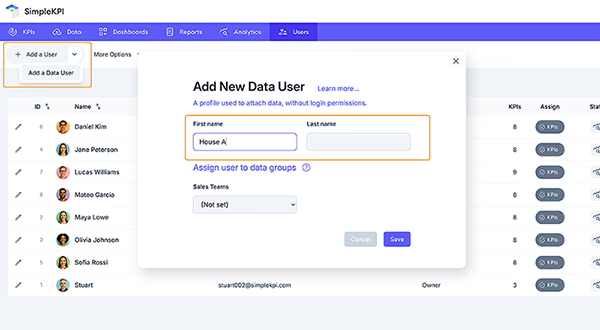
Add a Data User
- Click the dropdown selector next to Add a User.
- Choose Add a Data User from the menu.
- Upload an image for your data user (optional).
- Enter a name for your data user.
(The form currently asks for First Name and Last Name, but you can simply just use first name for other entities such as products) - Click Save.
The Users list displays full-access users and data users separately, you can switch between them using the Active Users and Data Users toggle buttons above the list.
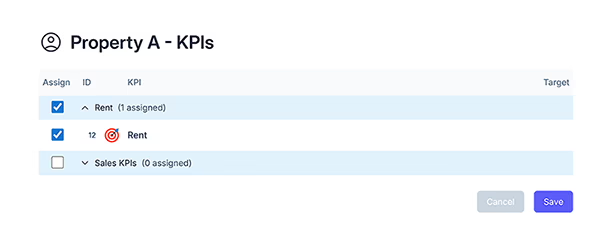
Assign KPIs to a Data User
- For your new data user, locate the Assign column and click the KPIs button.
- In the popup, choose individual KPIs or assign an entire folder by clicking the checkbox next to the desired items.
- Click Save to assign the KPIs.
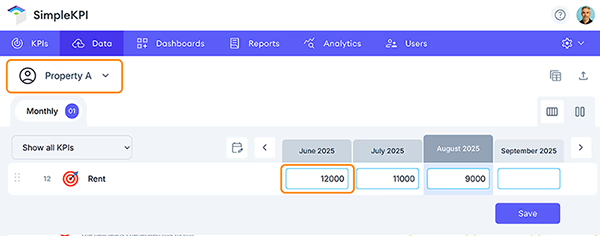
Add Data for a Data User
- Head to the Data tab.
- Use the dropdown in the top left to select your data user, product, or property.
- Enter the KPI data for the chosen data user.
View Data Users in Dashboard Charts
Include Data Users in Charts
- Add a new chart or edit an existing one in your dashboard.
- In the chart editor, expand the Data Filters menu on the right.
- Click the All Users dropdown and use the checkboxes to select which data users/products you want displayed in the chart.
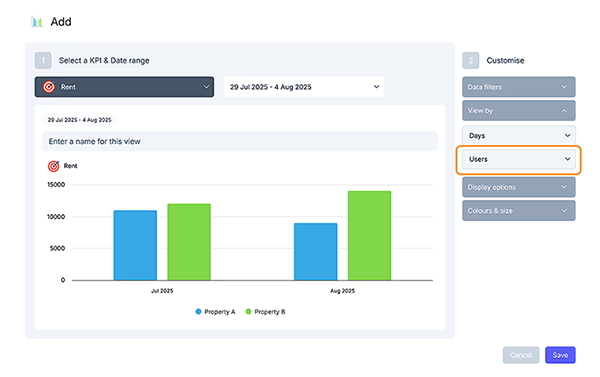
Compare Data Users on a Single Chart
- Select the Single Column Chart type.
- In the right menu, click the View by selector.
- From the menu, expand Groups and select the Users option.
- This displays each data user as a separate column on the chart, letting you easily compare their performance.
Import Data for Data Users (Excel / Google Sheets)
- Create a spreadsheet with these columns: User (Data User ID from the Users tab), Date, then one column per KPI (use the KPI names as the column headers).
- Enter KPI actuals in the cells (each row = one date for one data user).
- To import via Excel/CSV: go to the Data tab, click Import data, choose your file, then click Upload and Import.
- To import via Google Sheets: connect your sheet in Data Sources (navigation dropdown) → Storage → Google Sheets, then set the Sheet ID and import frequency.
Example layout
| User | Date | Revenue | Budget | Expense |
|---|---|---|---|---|
| 5 | 2026-02-01 | 1000 | 2000 | 3000 |
More Reading
- Users: Learn more about full-access and data users.
- Assigning KPIs & Targets to Users: How to allocate performance indicators.
- Dashboard Charts: Explore creating and customizing charts for rich data visualization.
- Groups and Group Items: Organize users and data users into logical categories.
- Manual Data Entry: Step-by-step guide for entering KPI data.